I love Thursdays. Always have. But I know for a lot of revenue leaders, Thursday afternoon is the worst time of the week. You're staring at a forecast deck, your gut says something's off, and you can't figure out what.
The spreadsheets look fine. Reps sounded confident in their deal reviews. But when the quarter closes? Deals vanish. And now you're explaining the gap to the board.
Here's what gets me fired up: that old way of forecasting is broken. And we're building something radically better. I'm talking about the ability to analyze dozens of accounts at once, surface risks before they bury you, and actually see what moved in your forecast and why.
Let me walk you through three features we just released that are changing how the best teams forecast.
Your Early Warning System
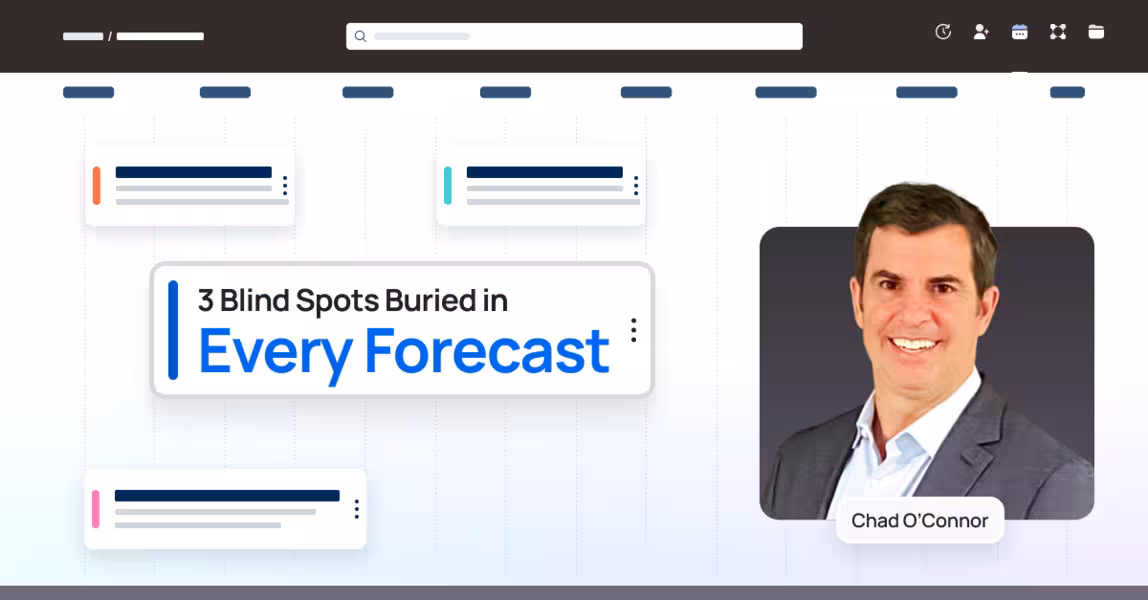
Picture this: You open your forecast Thursday morning. Instead of mind-numbing spreadsheets or stale CRM snapshots, you see Headlines.
These are the top three risk themes in your forecast, ranked by deal value at stake. Things like "Deals Slipping," "Pipeline Coverage Gap," or "Missing Exec Engagement." The stuff that matters, surfaced automatically.
What makes this different from staring at a spreadsheet? People.ai Headlines analyze activity data, not just stage changes. It reviews emails, meetings, and calls to find where risk is building before a deal blows up. No more detective work. No more rummaging through individual opportunities. The story finds you.
Click into any theme and you see exactly which deals are triggering it, with full context on the size of the risk.
Find the Pattern Behind the Problem
Seeing risk is one thing. Understanding why it exists is everything.
Say your Headlines flagged "Deals Slipping in Enterprise." You click in and select those 20 or 30 at-risk opportunities. Now, instead of eyeballing each one separately, you let AI do the heavy lifting.
You can ask questions across all those accounts and deals at once. The AI synthesizes entire deal histories: engagement metrics, CRM fields, stakeholder data, scorecards, everything. Within seconds, it spots the patterns.
You might see "80% of these slipping deals haven't had executive-level touches in two weeks" or "manufacturing accounts are bouncing because of a newly surfaced competitor."
That's the kind of insight that changes where you focus your team's energy. And you get it in seconds, not hours.
Prove Your Fix Is Working
Okay, so you've flagged what's wrong. You've diagnosed the root causes. But here's the question I hear all the time: how do you prove your fix is actually working?
That's where Waterfall Charts come in. They track how your forecast number evolves week to week, breaking down exactly what's moving: deals won, deals lost, slips, new business, all of it.
No manual setup. No macros. It just works out of the box. Click on any bar and you see the exact opportunities responsible, including close dates, next steps, and why it slipped.
Every stakeholder sees the same truth. You walk into your forecast call with clarity instead of crossed fingers.
How These Three Work Together
Here's what a day looks like when you put all three together:
Morning: Start with clarity. You open People.ai Forecasting and scan your Headlines. Right away you see it: your biggest risk is in late-stage deals across the Southeast. That's your red zone.
Midday: Dig into the why. You click "Deals Slipping in Southeast," pull in every relevant deal, and run Multi-Record Analysis. The AI reveals that deals without recent exec-level engagement are far more likely to slip. You call your AEs and tell them it's time to get back in front of those VPs.
Next week: Track the impact. You revisit your Waterfall Charts. The "slipped deals" line has shrunk. You can tie $1.2M of regained commit directly to those re-engagement efforts.
You didn't just identify risk. You understood it, acted on it, and validated the results. That's forecasting that drives real revenue.
From Risk to Revenue
Look, I've been doing this a long time. Traditional forecasting is a mess: stale data, manual checks, blind spots, too many last-minute surprises. It doesn't have to be that way.
With Headlines, Multi-Record Analysis, and Waterfall Charts, you get real-time visibility into what's at risk, root-cause intelligence on why, and proof that your actions are moving the needle.
Stop guessing your number. Start owning it.
Ready to see what this looks like for your team? Explore People.ai Forecasting
Related Insights
Explore more expert insights on AI adoption, sales execution, and revenue intelligence to help your team close more deals with confidence.