
When asked about the standard sales metric used to measure sales rep productivity, Oleg Rogynskyy, CEO of People.ai, said, “I don’t think there’s a single ‘standard’ measure of productivity that works. How you measure productivity changes from company to company.”
The sales productivity of your team isn’t a one-size-fits-all process, but it still is a process. Consistent sales and revenue growth come from a scalable, replicable sales process that yields results each time. Once you have that, your business can grow with new team members that can be trained on the winning formula.
Unfortunately, this can’t occur until you’re fully aware of what works for your business and, perhaps more importantly, what doesn’t. While you may know who’s a consistent performer time and time again, that knowledge can’t be passed on to the rest of the team until you understand why they perform well.
Improving sales productivity comes from understanding how and why to monitor your sales metrics. What you can gain from this information helps you make proactive decisions to elevate your business.
What are Sales Metrics?
A sales metric is a data point that represents the performance of individual sales reps, sales teams, or even the entire company. Sales teams use metrics, also known as key performance indicators (KPIs), to measure how much progress they’re making towards their goals, whether they should award bonuses or offer incentives, and to pinpoint weak points. Key performance indicators can also help companies brace for the effects of market changes or make plans for growth in the future.
Ideally, the productivity distribution between your high-, medium- and low-performing sales representatives should be balanced, and the team as a whole should see consistent success.
A sales target, also known as a quota, is the number of sales a representative or sales leader aims to make in a specified period of time. This is usually measured in revenue or volume.
Sales Metrics
These are some of the most common sales metrics used to measure company-wide performance:
1. Total Revenue
Arguably the most important metric of any business is revenue. Total revenue can be measured on any time scale, typically monthly, quarterly, or annually.

Annual Recurring Revenue, or ARR, is a common metric of sustained RevOps performance. Similarly, Monthly Recurring Revenue, or MRR, is an equivalent metric on a shorter time frame. ARR is a great metric for predictable revenue when reps are closing multi-year contracts and retention rates are high.
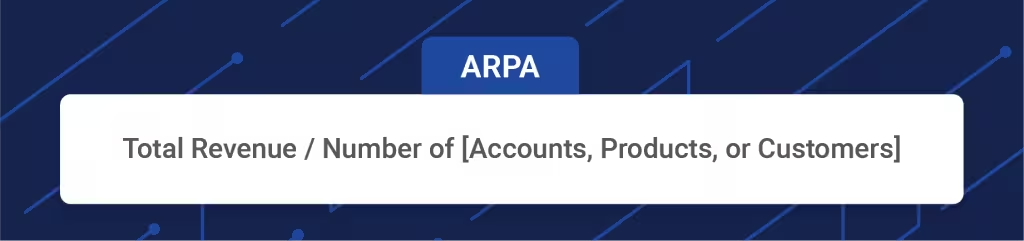
2. Average Revenue Per Account/Product/Customer
The average revenue brought in by a single product, service, account, or customer helps leaders and managers to understand where they should focus their attention and resources. It’s also important to know when your business is heavily weighted and dependent on a few key accounts, which will be evident by a higher ARPA.
3. Market Penetration
Understanding your market share is important because it measures where your business is compared to the expected growth outlined in your business or sales plan. Usually, you will find businesses measuring this against their total addressable market (TAM), which is an estimation of how big a given market is for a product or service.

It’s worth noting that markets are dynamic, meaning that they can expand or contract for a number of reasons. For example, when Salesforce was preparing to go public in 2003, they stated, “We believe that the CRM applications market was approximately $7.1 billion in 2002.” In the last 12 months, Salesforce revenues were more than $21 billion, which demonstrates that the market for CRM software has grown significantly.
4. Percentage of Revenue from New vs. Existing Customers
Understanding what percentage of revenue is from new and existing customers is helpful for a few reasons. For example, if existing customers account for a growing percentage of total revenue, this can be an indicator your RevOps team is doing a great job of upselling and growing accounts, but the team tasked with acquiring new logos is lagging behind.
If new customers are the lion’s share of your revenue, then this could either be an indicator of a high churn rate or hypergrowth. To understand at what end of the spectrum your team is trending, it’s important to track LTV, NPS, and more, which we will discuss later in the guide.

5. Win Rate
Win rate, or the opportunity-to-win ratio, is the measurement of successful deals or deals that close, in comparison to the total deals made – including those that are open, lost, slipped, or in another pipeline phase. Basically, win rate measures sales effectiveness or the ability of a sales team to conclude negotiations.
There are a number of factors that contribute to a sales team’s win rate, many of which are covered later in this article. We have also identified the key factors that can enable you to double your win rate.

6. Year-Over-Year Growth
Although growth can be measured over any timeframe – such as month-over-month, quarter-over-quarter, or year-over-year – annual growth showcases high-level execution of strategy and whether long-term growth goals have been achieved.

The formula for calculating year-over-year (YOY) growth is as follows, assuming that revenue last year was $50 million and the current year’s revenue has grown to $75 million:
[($75MM – $50MM) / $50MM] * 100 = 50% YOY Growth
7. Lifetime Value (LTV) of a Customer
Lifetime value is the revenue that can be expected throughout the duration of the average relationship with a customer. Once a relationship and rapport have been established with an account, your team would ideally nurture this existing relationship to keep them satisfied and grow the lifetime value of the account.
LTV is an important sales metric because if your average contract value (ACV) is greater than or equal to your average LTV, it can signal deficiencies in your products or services. Plus, your ongoing sales expenses will likely erase any profit margins.
Retention rate and churn rate are important factors in LTV and should be considered when determining the sustainability of your sales team. There are two ways to increase LTV: increase ACV or increase retention rate.
%2520of%2520a%2520Customer.avif)
If your ACV is $500K, for example, and the average customer renews their two-year contract once for a total retention period of four years, the LTV is $500K * 4 or $2 million.
If you want to truly understand the lifetime profitability of your customers, append your profit margin to the equation for lifetime profit (LTP) – not a widely used metric, but vital in our opinion.

8. Net Promoter Score (NPS)
What is the likelihood that your customers will recommend your product or service to their network?
This question is what sales professionals have in mind when they measure net promoter score, where they ask each customer the likelihood of them promoting their business through word of mouth from 1 (not very likely) to 10 (very likely).
.avif)
NPS can be a proxy for customer satisfaction, as we can assume one would only share a product, service, or business they trust and respect. Your champions are those that reported 8-10 on your NPS survey, and detractors are those who reported 7 or lower.
9. Quota Attainment
Quota attainment tells you whether a sales rep has reached their sales quota within a given time period and what percentage of their quota they have reached. This is an important metric to measure because low quota attainment rates can be a symptom of more complex issues within the sales team, including inadequate coaching, rep ramping, and capacity planning.
It’s worth noting that we believe progress towards quota attainment should be tracked in your BI dashboard to intuitively understand how sales activity metrics (more on these later) directly contribute and correlate to quota attainment.

A natural next question for any sales leader or sales manager is what percentage of sales representatives are reaching 100% of their sales target?

10. Pipeline Coverage
Salespeople at all levels must understand the health of their pipeline compared to their quota. This sales metric will be a leading indicator towards quota attainment – if you don’t have an adequate pipeline to cover your quota, it’s going to be extremely difficult to achieve your goal.

Deal slippage can interfere with the results of this metric because if your reps mark an opportunity that slipped from the last period as committed this period, it can offer a false sense of coverage. People.ai scores opportunities based on the actual activity in the pipeline, offering a more accurate analysis of pipeline coverage.
11. Sales Expense Ratio
It’s important to understand how your sales costs, direct customer acquisition costs, and indirect operating expenses compare to your revenue. The higher your sales expense ratio, the less profitable your sales organization will be.
Startups typically see their expense ratios go up as their reps ramp and they move up the product adoption curve. But as the market reaches a state of equilibrium – in other terms, matures – you can expect your sales expense ratio to go down.

Already have the right sales performance metrics? Check out how to improve sales effectiveness.
What Are Sales Productivity Metrics?
Sales productivity is a measurement of how efficiently your sales representatives reach their sales targets. The more time you take to meet your sales goals, the lower your sales productivity. Whether you were able to reduce costs in the process is also tied to your productivity.
Just as productivity is measured in the field of economics, sales productivity is measured in a similar fashion, where output or revenue is measured against every unit of input. The goal of observing sales productivity metrics is to pinpoint which inputs result in the highest output.
How Can Sales Metrics Increase Sales Performance?
In a data-driven world, a sales professional can no longer rely on their gut or instincts. Today, data drives decisions – without the proper metrics to measure their teams' productivity and performance, a sales manager will be severely handicapped.
If you want to gain an edge in today's competitive marketplace, you need to be able to identify what your most effective sales strategy is, how fast your sales and marketing team can accomplish their targets, and whether your sales goals are truly attainable.
Ultimately, sales metrics provide sales leaders with key insights into the performance of individual sales reps and the overall performance of the organization, and whether this aligns with the goals they've set at the beginning of the year, quarter, or month.
Metrics To Measure Sales Performance
Sales productivity metrics include the following, mostly measured in percentages:
- Time spent selling
- Time spent on manual data entry
- Time spent creating new content
- Number of marketing collaterals utilized by sales reps
- Number of sales tools utilized by each sales rep
- Number of follow-ups from high-quality leads
What Are Sales Activity Metrics?
Alternatively, a declining quota attainment may indicate a lengthening sales cycle, which could These metrics tell you what your sales representatives spend their time on every day. For sales leaders and managers, sales activity metrics are an invaluable tool for assessing the productivity and efficiency of their sales team.
Sales activity metrics can show you where your team or individual representatives’ strengths and weaknesses lie, what tools work best for them, and which areas they can improve on.
These are the sales activity metrics that are worth tracking:
- Phone calls
- Emails
- Conversations
- Social media engagement
- Scheduled meetings
- Demonstrations
- Sales presentations
- Referral requests
- Proposals
Tracking a rep’s activity can be mistaken for micromanagement. Instead, frame how a rep’s sales activity measures up to the macro-landscape of the broader team’s activities to clarify their impact and improve execution.
What Are Sales Pipeline Metrics?
As a sales leader, the health of your pipeline is about as important to understand as a doctor taking a patient’s “vitals”. Many of the sales metrics discussed above can indicate the health of one’s pipeline, but they can also influence that health.
Net Promoter Score, for example, might seem like a customer satisfaction metric exclusively, but it can impact your sales pipeline. If your existing customers are recommending your product or service to their network, you are more likely to experience organic pipeline growth and unexpected revenue.
Quota attainment and rep quota attainment can be measured and monitored to understand if and when quota adjustments should be made. Overwhelming quota attainment, for example, might mean there is more opportunity to grow than initially expected, and targets should be adjusted to motivate performance.
Alternatively, declining quota attainment may indicate a lengthening sales cycle, which could necessitate a decreased quota and increased focus on closing later-stage deals.
Sales pipeline metrics include:
- Length of the sales cycle
- Open opportunities by month or quarter, team or individual
- Closed opportunities by month or quarter, team or individual
- Value of the pipeline by month or quarter, team or individual
- Value of sales by month or quarter, team or individual
- Average contract value (ACV)
- Win rate
- Conversion rate
What Are Lead Generation Sales Metrics?
Prospecting is the pump-priming of your sales pipeline. Any sales organization worth its salt will need to measure lead gen performance and continue to monitor leads as they flow through the sales process.
Having a firm grasp on lead generation can indicate how well your sales and marketing organizations are functioning — or dysfunctioning. Lead generation sales metrics include:
- Volume of new opportunities
- Lead response time
- Percentage of lead follow-up
- Percentage of lead follow-up within a given time frame
- Dropped leads
- Qualified leads
- Customer acquisition cost (CAC)
Leading vs Lagging Indicators
Your performance indicators are broken down into leading and lagging indicators.
Leading indicators are more difficult to measure, but they can be more easily influenced with enough planning. These help you predict the results of your performance. A good example of a leading indicator is sales activity metrics.
Lagging indicators, on the other hand, are a reflection of your results. Some examples of lagging indicators are low quota attainment or top-of-the-funnel weakness.
Sales Tracking Tools
With so much information to keep track of, utilizing revenue intelligence systems like People.ai can keep everything organized and ensure you can make informed decisions within a sales process moving forward.
A customer relationship management tool (CRM) allows sales professionals to track and monitor all their customers’ and prospects’ data in one main hub. With this data, sales teams can make more accurate sales predictions, reports, and strategic business decisions.
Tools like People.ai automatically track contact and activity and populate your CRM with accurate, real-time data to the right opportunity accounts.
With all the key information organized in a CRM, marketing automation keeps track of all the leads that come through the sales pipeline. This data can then be used to get a more comprehensive look at how prospects think and act – data that will be integral to your sales reports.
A buyer activity tracker monitors and logs the sales interactions from the buyer’s side, such as the content shared within the buying team, so your sales representatives can take action in real time.
Once you know how buyers respond to your content and interactions, that information can be used to coach sales representatives in effective sales. People.ai shows the calls, emails, meetings; identifies people in the buying group; and benchmarks sales rep performance for targeted coaching.
A customer relationship management (CRM) tool is the main hub of information on your customers and People.ai can take over the time-consuming administrative work, allowing sales representatives to spend more time selling and closing deals. AI in sales can tackle activity logging, identify high-priority leads, create new contacts, predict a forecast for the quarter, and more. This all saves time and helps you become more proactive as a sales leader in managing your sales team.
Create a Winning Team
Sales metrics help organizations create a replicable process that, in turn, can lead to faster, and more predictable growth. And with AI sales tracking tools, collecting and monitoring these sales metrics becomes a piece of cake. Plus, with a central hub that retains all your key data points, you can easily review all the necessary performance indicators when you want, where you want, and account for performance weaknesses in your team, sales pipeline, and overall strategy.
In Stephen Covey’s The Seven Habits of Highly Effective People, he said, “When people are crystal-clear about the most important priorities of the organization and the team they work with and prioritize their work around those top priorities, not only are they many times more productive, they also discover they have the time they need to have a whole life.”
Frequently Asked Questions About Sales Metrics
What are sales productivity metrics?
These measure how productive your sales reps are and whether they're on track to achieve their goals for the month, quarter, or year.
How can sales metrics increase sales performance?
Sales metrics serve as a reminder to reps on whether or not they're hitting their sales KPIs and sales goals within the appropriate time frame. This gives them a chance to recalibrate their approach and cast aside strategies that may be costing them time and money.
What are the most valuable sales metrics?
Some of the most valuable sales metrics include:
- Total revenue
- Average revenue per account (ARPA)
- Percentage of revenue from new vs. existing customers
- Win rate
- Year-over-year growth
- Lifetime value (LTV)
- Net promoter score (NPS)
- Quota attainment
- Pipeline coverage
- Sales expense ratio
How to track sales metrics?
Sales metrics can be tracked using a number of sales tracking tools. One of the most important tools to have in your arsenal is a customer relationship management or CRM tool, which serves to consolidate all the important data and insights you need on all your customers and prospects.
Related Insights
Explore more expert insights on AI adoption, sales execution, and revenue intelligence to help your team close more deals with confidence.